It might seem ironic that equities would fall so hard. After all, a week ago, one of the best employment reports in four years was released.
You can find any number of reasons for the plunge. The week after NFP is often weak. Most of the indices had hit long term trend line tops. SPX was near its 2100 "round number" resistance which in the past has been followed by a 3% or more fall. Measures of "dumb money", like equity inflows, had hit one year highs; when "dumb money" is happy to be long equities, the run is usually close to an end. These reasons, and others, were detailed a week ago here.
The question now is what lies immediately ahead. We think risk/reward on a one month basis is now positive. Let's review.
First, recall that last Friday SPX had completed a streak of 7 weekly closes higher. We looked at all 10 times that had occurred since 1980. All 10 made a higher closing high in the weeks ahead. That should be intuitive; 7 weeks higher is a sign of strong positive momentum that will not suddenly end. The trend needs to weaken before reversing. This week might be the beginning of a bigger weakening process, but it seems unlikely that last week's high marked a long term top.

SPY ended the week near 200. This was an important resistance area for part of August and most of September. In the chart below, note the large trading volume near this price (left side). There is risk to 197.5, another 1.5% lower. Importantly, the fall this week closed some of the large open gaps left by the uncorrected rise since October (in yellow). A significant gap from October 31 closes at 199.5. For more on these gaps, read here.

Both SPY and the Dow ended the week right on their 50-dma. This is their first touch of the 50-dma in more than a month. On its own, that may not make it great support but combined with the prior resistance from September improves the likelihood that this level holds within 1%.

Treasuries have been the best performing asset class in 2014. Remarkably, the consensus remains bearish heading into 2015. This week, TLT broke above its 2014 trend line; it has only been this extended from its 13-ema twice before in the past year. The trend is higher, but there appears to have been panic buying this week; it's likely this will subside next week, as it has previously. That should be a positive for equities.

TLT broke above both its daily and weekly upper Bollinger Band. Shown below is the weekly chart; in the past 5 years, aside from mid-2011, TLT has retraced at least some of those gains in the following week.

The panic selling in equities is most clearly seen in the Vix. Vix increased more than 70% this week. In the past 4 years, this has only happened 3 other times, all very near or at bottoms. Going back further to 2010, however, SPY bounced but then continued lower.

When these spikes in Vix have occurred in December, they have been especially favorable to equities. Even a 34% spike off the low has led to a positive return by month end every time this has occurred; this implies a close over 206.5 in the weeks ahead (chart from Dana Lyons).

The spike in Vix last week was 4 standard deviations above its 20-dma. In past 3 years, the only other times this has happened were at the February low and within two days of the October low.

Vix closed over 20 on Friday. According to SentimenTrader, when Vix closes over 20 for the first time in a month, SPX has rallied 22 of 26 times (85%), gaining an average of 2.3% in the next month. Only 2 of 26 (8%) led to significant losses that were not soon reversed.
It's noteworthy that spikes above 20 have been near the bottom for equities the past two years. The last time SPY continued to fall (and Vix continued to rise) was in mid-2012; SPY fell another 3.5% over the next two weeks but the index was higher a month later.

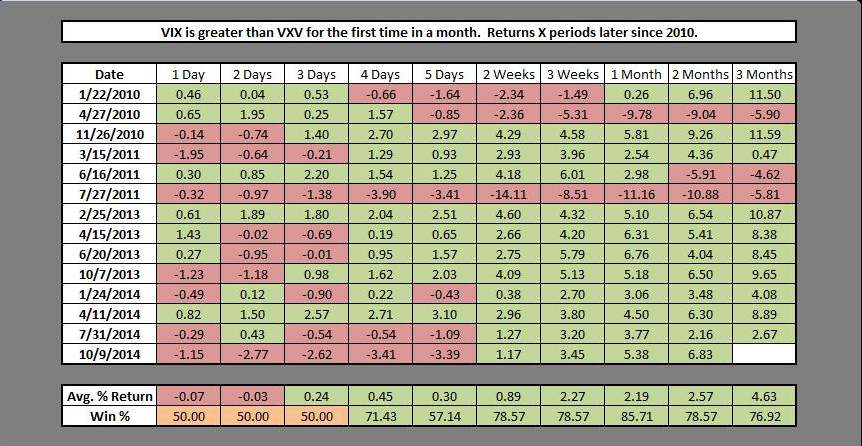
The VIX term structure inverted on Friday. This happens when VIX (1 month forward volatility) trades higher than VXV (3 month forward volatility). This means near month protection has become relatively more expensive; normally, protection farther in the future is more expensive. It's another indication that investors started to panic. Returns in SPY are mixed short term, but higher nearly 80% of the time two weeks later (chart from Chad Gassaway).
It's quite possible that SPY moves higher this coming week. On Thursday, SPY rose while Vix rose 6%. This has happened 17 other times in the past 20 years; SPY closed higher within a week each time. This implies a close over 204.2 by Thursday (chart from Rob Hanna).

The selling this week was remarkable. The volume of declining stocks to advancing stocks was 16:1 on Wednesday (a major distribution day). Trin spiked to 3.5. That combination had not been seen since the exact low in February 2014. To be clear, this can lead to a cascade lower in equities; this is what happened in 2011. That is a risk. But more often, stocks are close to a short term bottom.

That is especially true when a major distribution day occurs in December. This has happened just 14 times in the past 40 years; in 13 of those, equities finished the year higher. This implies a close over 203.2 in the weeks ahead (chart from Dana Lyons).

Drawdowns like those seen this week are not unusual; since 1928, the average December has seen a drawdown of 3.7% (stat from Walter Murphy). But a substantial close lower in December is very rare (post on this here). More likely, this week's selloff is following a seasonal pattern. This pattern turns favorable this coming week (chart from Schaeffers).

According to Rob Hanna, since 1961, the next 3 weeks are all among the top 10 most profitable weeks in the year. This coming week is also Opex; in December, Opex has been higher 80% of the time. It is the most consistently profitable Opex week of the year.
.png)
The selling this week was dramatic. There is always the risk that it could continue. While the balance of data suggests a reversal is likely, there remains a high level of complacency in the market that will not dissipate so quickly (read further here). Put/call ratios have turned higher from the lowest levels in a year but are not at a level that has marked prior bottoms in equities (chart from McMillan).

But the biggest wild card is the price of oil, which fell 12% this week. The near term price of oil is wrapped up in politics. What happens next is anyone's guess. Russia's Putin has previously used an incursion into the Ukraine to divert dissatisfaction at home with the domestic economy, and he could do something similar again. Instability, geopolitically and in the price of oil, would be felt worldwide (text below from Mohamed El-Erian).

Oil futures settled on prices below $60 that had relevance in 2005-07 but none in 2008-09 (arrows). Assuming the world is not on the precipice of a major recession, we think oil prices are likely to be higher a year from now (post on this is here).

Our weekly summary table follows.

If you find this post to be valuable, consider visiting a few of our sponsors who have offers that might be relevant to you.